
Architecture
There is no collector, sidecar, or proxy between your agent and the platform. SDKs (and any OTel exporter) POST OTLP protobuf to the API. The request handler writes the spans, projects each one onto its capability and session, and queues trace scoring: The write and the projection run inside the request, so a200 response means the spans are stored and attributed. Re-sending the same spans is safe: rows are upserted on span_id. Trace scoring is queued once per root span that lands in the batch and runs on the io_traces Celery queue.
The OTLP endpoint
The
/v1/traces alias exists so a stock OTel HTTP exporter works with only a base URL — exporters append /v1/traces themselves:
overmind.project.id resource attribute (you must be a member), otherwise from your first project membership. Trace ingest is never credit-gated. A self-hosted API takes the same requests at http://localhost:8000.
Getting traces in
The empty Observability page opens Instrument your repository: pick your coding agent and copy the prompt. The prompt tells the agent to installovermind[tracing], call the get_instrumentation_plan MCP tool for exact placements, apply them, and verify one real trace with verify_instrumentation — the loop the /overmind ensure-tracing command runs. See MCP.
In a local repository, run overmind scan push first: it writes the project credential to .overmind/credentials.toml, which the Python SDK reads. Deployed processes and non-Python exporters receive OVERMIND_API_KEY through their runtime secret configuration. To instrument by hand:
- Python SDK
- TypeScript
- Any language (raw OTel)
- Connectors
init(), calls made with the OpenAI, Anthropic, Google Gemini, Agno, and LangChain client libraries are captured automatically — prompts, completions, tool calls, token usage, latency, and errors. run() brackets one agent run and deliver() marks its result, which is what trace scoring judges. See the Python SDK reference for the decorators that trace your own code.How spans map to the data model
A trace is not a separate record: it is the set of span rows sharing atrace_id, and the root span (the one with no parent) is what the trace list shows. Each stored span keeps the OTLP payload — timing, status, resource attributes, span attributes, events, and links — plus fields computed at ingest: a span type, an operation name, a usage projection, and foreign keys to the project, capability, and conversation it belongs to.
Span classification
Each span is typed at ingest, in priority order:- An explicit
overmind.span.typeattribute is stored verbatim (entry_point,workflow,tool_call,function,llm_call,retrieval— what the SDK decorators set);overmind.span_typeand baretypeare accepted spellings. - An OpenInference
openinference.span.kind:llmandembeddingbecomellm_call,toolbecomestool_call,retrieverandrerankerbecomeretrieval,chain,agent,guardrail, andevaluatorbecomeworkflow. gen_ai.operation.name = "execute_tool"or atool.nameattribute marks the spantool_call.- A span name containing
tool,function_call,function.call, orexecute_toolmarks ittool_call. - Otherwise the span is
llm_call.
has_model=true) is the test for a model call; span_type=llm_call includes unlabelled spans that fell through to the default.
Attributes the ingest pipeline reads
The pipeline reads three attribute dialects — the Overmind SDK’sgenai.* / overmind.* keys, the OTel GenAI semantic conventions, and OpenLLMetry/OpenInference keys. Aliases are coalesced onto the canonical key at ingest; an existing canonical value wins.
overmind.* keys nested inside an inputs, outputs, or traceloop.entity.* payload are also read, at lower priority than resource and span attributes. Traceloop scope names under @traceloop/* are rewritten to @overmind/* on the way in.
Capability attribution
Traces attach to a capability through one attribute:overmind.capability.id— the capability’s UUID, or an identity the project knows for it: its manifestkey(= slug) or its name. The only key ingest binds by; stable through renames. A span-level id wins over the resource-level one, so one process can serve several capabilities.overmind.capability.name— a display label shown beside raw span attributes. It never resolves a capability.
overmind.init(capability_id=...), or a capability(..., id=...) scope per request in a multi-capability process; switching capability mid-trace is a handoff that trace scoring scores as its own unit. A child span that carries no identity — a subprocess, say — inherits the trace’s capability when the trace maps to exactly one.
An id the project does not know never creates a capability. The span lands under the Unbound capability filter instead, and binds retroactively once the id resolves (a scan push that creates the capability, or a restored one). Push the scan first, then copy the id or key into the SDK.
Sessions
Stamp a sharedconversation.id on the traces of one multi-turn exchange — set_conversation_id("session-42"), or run(conversation_id=...) — and Overmind groups them into a session with trace and span counts, tokens, cost, timespan, and a session score folded from the conversation’s task executions. The Sessions view in Observability lists them.
Trace status
A trace iscompleted once its root span has landed, live while spans are still arriving without a root, and interrupted when no root arrives inside the settle window (TRACE_SETTLE_SECONDS, default 600 s). GET /api/traces/ rows and GET /api/traces/{trace_id}/ carry it as trace_status; a live trace keeps polling in the Console.
Scores on arrival
When a root span lands, the platform carves the trace into units, binds each unit to one of the capability’s behaviours as a task execution, and runs the trace-scoring members of the active eval set against each unit. Every verdict is stored as its own row, read overGET /api/verdicts/; the unit’s span keeps the composed markers in feedback_score.trace_scoring, whose _execution.score is the composite the Console shows in the Score column. Sessions get a score of their own. A trace that never sends its root is picked up by a sweep once it is interrupted. The full contract — carve precedence, binding sources, how claims compose, the marker shape — is on Trace scoring.
Exploring traces in the Console
The Observability page is a filterable table with three views:- Task executions (default) — one row per scored unit: Capability, Task (the behaviour it bound to), Score, Status, Duration, Tokens, Cost, Model, Conversation, Terminal, Time. Group by conversation folds a page’s rows under their
conversation.id. - Root traces — one row per trace; the only view with bulk selection for datasets.
- Sessions — one row per
conversation.idwith trace and span counts, tokens, cost, model, timespan, and the session score.
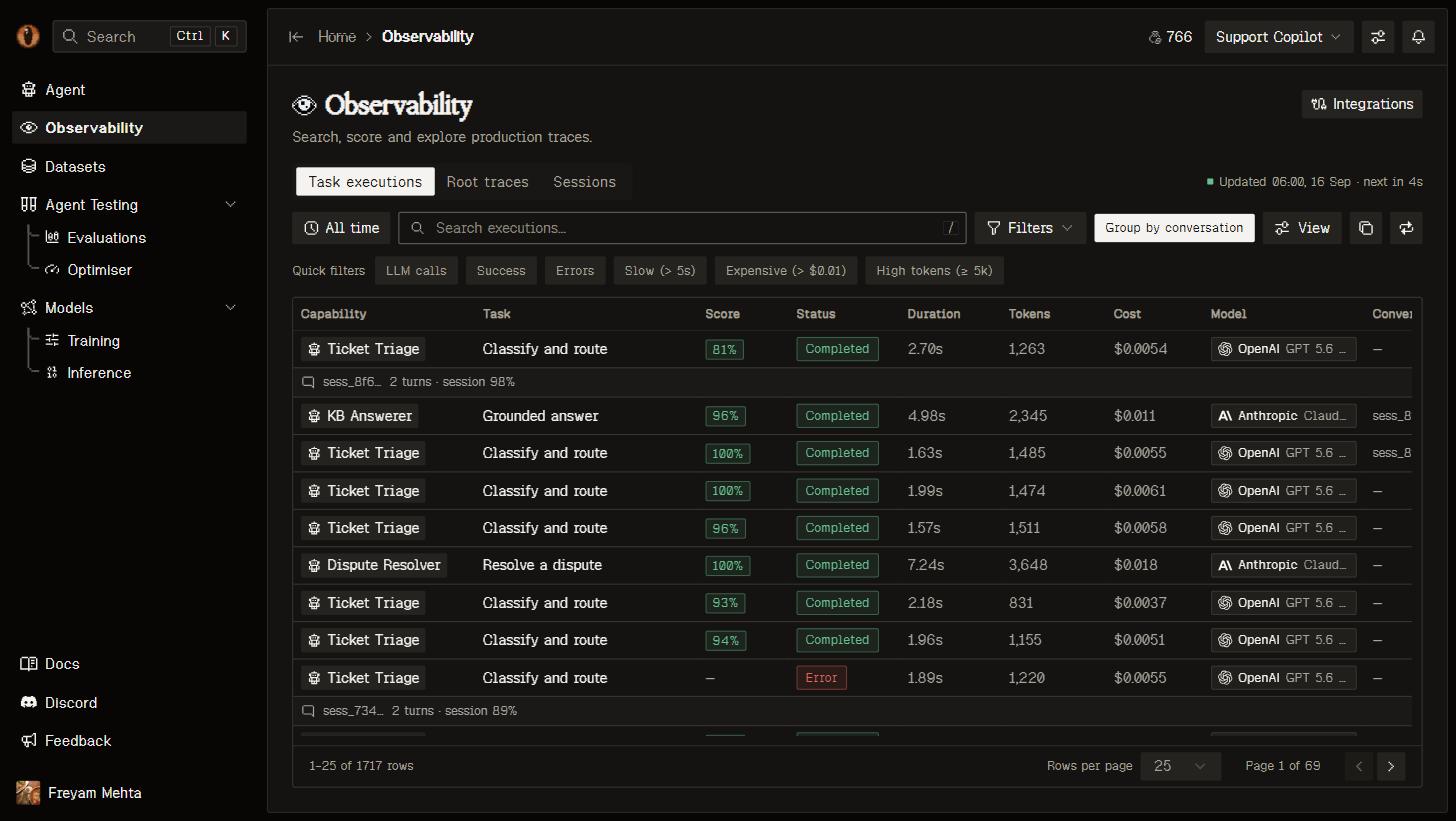
Task executions with quick filters. The Score column carries the execution score; the Task column names the behaviour the unit bound to.
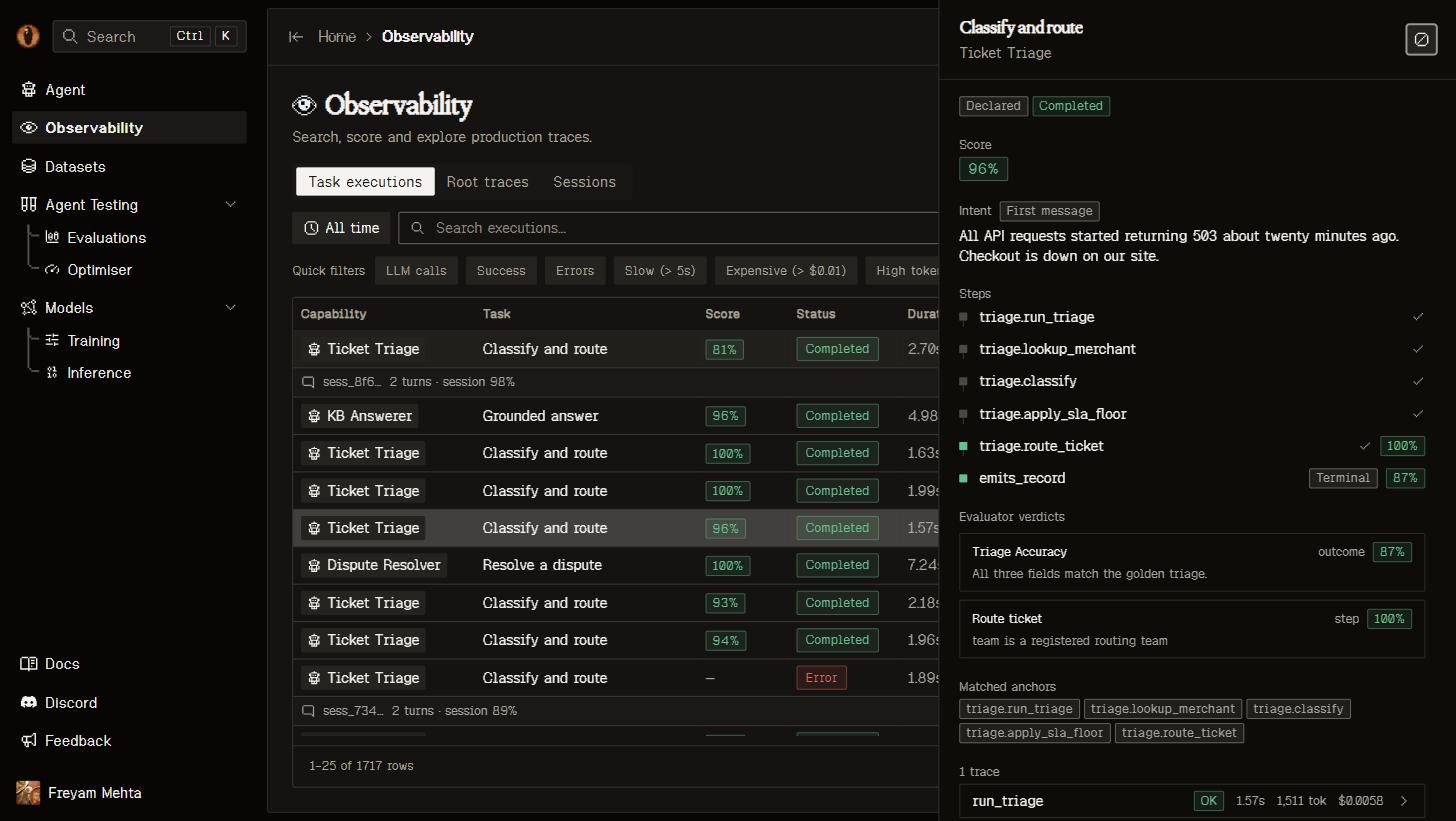
An execution: the intent, the route through the behaviour's anchors, and each evaluator's verdict with its reasoning.
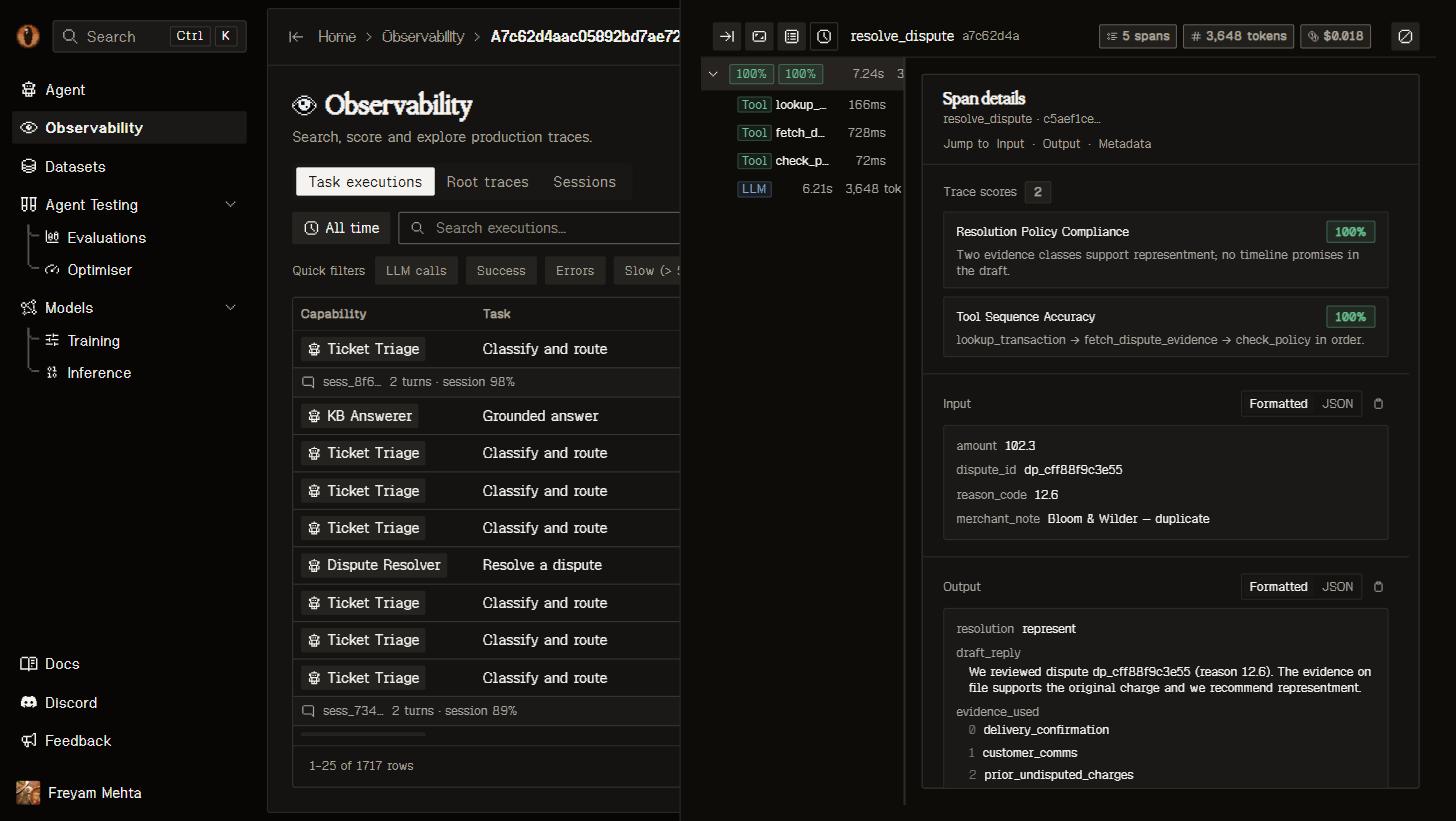
Trace detail: the span tree with token/cost rollups, plus the selected span's input, output, and verdicts.
From traces to datasets
In the Root traces view, select rows (or Select all across pages) and Add to dataset. One row per trace lands in the dataset with its wire transcript, delivered output, score, and a link back to the trace. Datasets covers what happens next.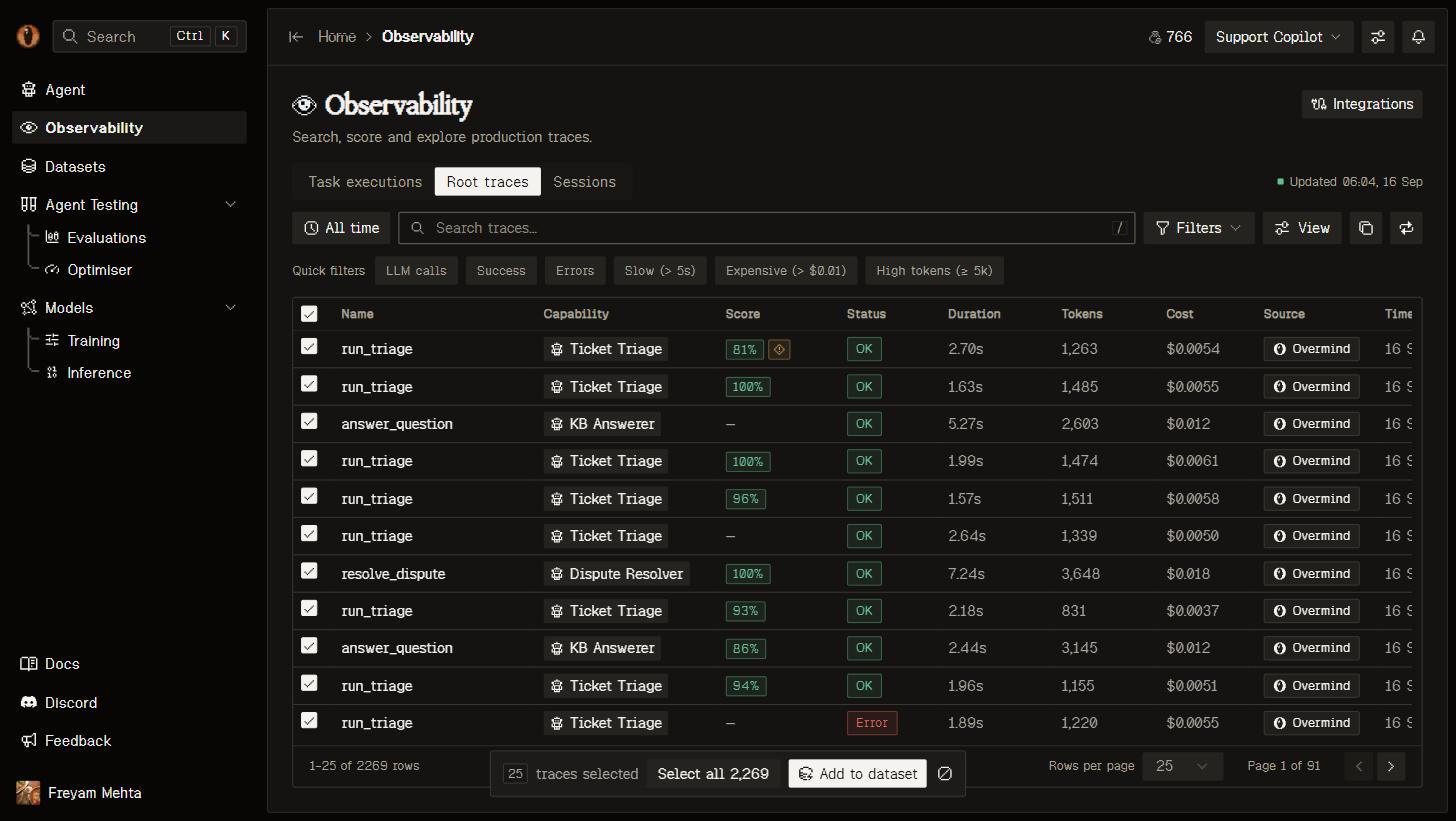
Bulk selection in the Root traces view: the selected traces about to become a dataset.
Reading traces over the API
Everything the Console shows is available over REST with the same API key:?all_spans=true on /api/traces/ returns every span instead of one head row per trace. Through MCP the same reads are query_traces, query_task_executions, query_failures, inspect_capability_health, and the overmind://traces/{trace_id} and overmind://sessions/{session} resources. See the REST API page for the full endpoint list.
Practical guidance
Initialise tracing once, at startup, before the first model call. Give each process its ownservice_name so its telemetry stays separate, and set the capability identity (capability_id) from the start. Auto-instrumentation alone produces flat model-call spans and no scoring unit: bracket every agent run with overmind.run(), call deliver() on the result, and decorate the functions the scan anchors on so each unit binds to its behaviour. A plain function span that starts its own trace outside a run boundary is dropped as an orphan fragment. run() flushes on exit; for short-lived processes with no run boundary, call force_flush_traces() before exit.