> ## Documentation Index
> Fetch the complete documentation index at: https://docs.overmindlab.ai/llms.txt
> Use this file to discover all available pages before exploring further.
# Observability
> Get your agent's runs into Overmind and watch each one arrive scored.
export const Ascii = ({lines}) => {lines.join("\n")};
Overmind speaks OpenTelemetry. Point your agent at the tracing endpoint and every run lands in the Console — scored as it arrives, grouped into conversations, and ready to become a dataset.
Nothing to run in between: no collector, no sidecar, no framework to adopt. If your agent already exports OTel spans, or your traces live in Langfuse, LangSmith, Braintrust or Galileo, you keep what you have.
## Getting traces in
Ask your coding agent. `/overmind ensure-tracing` reads your repository, works out where the instrumentation belongs, applies it, and verifies one real trace before it stops. Overmind's empty **Observability** page hands you the same prompt if you'd rather paste it.
Run `overmind sync` first. It saves your project credential to `.overmind/credentials.toml`, which the Python SDK picks up automatically — no key in your code. Deployed processes get `OVERMIND_API_KEY` through their usual secret configuration.
To instrument by hand:
```python theme={"dark"}
import overmind
overmind.init(
service_name="research-agent",
environment="production",
providers="auto", # instrument every provider SDK you have installed
capability_id="research-agent", # the capability's UUID, or its key from overmind.toml
)
@overmind.run(intent=lambda question: question)
def answer(question: str) -> str:
result = research(question)
overmind.deliver(result)
return result
```
After `init()`, your OpenAI, Anthropic, Gemini, Agno and LangChain calls are captured on their own — prompts, completions, tool calls, tokens, latency, errors. `run()` marks one agent run and `deliver()` marks the result, which is what gets scored. The [Python SDK reference](/tracing/sdk-python) covers the decorators for your own functions.
Node.js has no Overmind SDK yet — instrument it with OpenTelemetry directly, as in the next tab. See [the note](/tracing/sdk-typescript).
Any OpenTelemetry SDK — Go, Java, Rust, .NET — exports to Overmind with three environment variables:
```bash theme={"dark"}
export OTEL_EXPORTER_OTLP_ENDPOINT="https://api.overmindlab.ai"
export OTEL_EXPORTER_OTLP_PROTOCOL="http/protobuf"
export OTEL_EXPORTER_OTLP_HEADERS="x-api-key="
```
Or in code:
```go theme={"dark"}
exporter, _ := otlptracehttp.New(ctx,
otlptracehttp.WithEndpoint("api.overmindlab.ai"),
otlptracehttp.WithHeaders(map[string]string{"x-api-key": os.Getenv("OVERMIND_API_KEY")}),
)
```
Set `overmind.capability.id` as a resource attribute so your spans reach the right capability, and follow [the attributes below](#the-attributes-overmind-reads) to get the same scoring as SDK spans.
Import from **Langfuse**, **LangSmith**, **Braintrust** or **Galileo**. Add the provider's credentials with `overmind connector add ` (keys from env or a TTY prompt) or under **Observability → Integrations**, pick the source project and which capability its traces belong to, and Overmind backfills your history and then keeps polling for new traffic. **Sync now** pulls on demand.
| Connector | What you need | What arrives |
| -------------- | ---------------------------------------------- | ------------------------------------ |
| **Langfuse** | Public and secret key; host URL if self-hosted | Traces, evaluations, prompt versions |
| **LangSmith** | API key; API URL for EU | Traces, runs, threads |
| **Braintrust** | API key or service token | Project logs, spans, scores |
| **Galileo** | API key; API URL if self-hosted | Traces, spans, metrics |
Imported traces are scored on arrival and behave like native ones. Credentials are encrypted and only ever used to read. Provider keys never go through MCP — `overmind connector add` takes them from env or a TTY prompt, then the coding agent configures and syncs through MCP. See [CLI](/platform/cli#overmind-connector) and [MCP](/platform/mcp).
## The OTLP endpoint
| | |
| ----------- | ---------------------------------------------------------------------------------------------- |
| Endpoint | `POST https://api.overmindlab.ai/api/v1/traces` |
| Body | OTLP/HTTP **protobuf**, `Content-Type: application/x-protobuf`. JSON and gRPC are not accepted |
| Compression | `Content-Encoding: gzip` |
| Auth | `X-Api-Key: `, or `Authorization: Bearer ` |
| Response | `{"spans_ingested": N, "spans_post_processed": M}` |
A stock OTel exporter appends `/v1/traces` itself, so `https://api.overmindlab.ai` as the base URL is enough. Self-hosted, the same requests go to `http://localhost:8000`.
A project-scoped key pins every span to its project. Sending the same spans twice is safe. Trace ingest never costs credits.
### The attributes Overmind reads
Overmind already understands the OTel GenAI, OpenLLMetry and OpenInference conventions, so models, providers, token counts, costs, tool names and message payloads from existing instrumentation land without any mapping of your own.
These are the ones you set:
| Attribute | What it does |
| -------------------------------------- | -------------------------------------------------------------------------------------------------------------- |
| `overmind.capability.id` | Binds the span to a [capability](/core/capabilities). The only key that binds — set it as a resource attribute |
| `overmind.span.type` | `entry_point`, `workflow`, `tool_call`, `function`, `llm_call` or `retrieval` |
| `overmind.unit_kind` | `run` on the span that brackets one agent run, `turn` on a phase you want scored on its own |
| `overmind.delivery` | `true` on the span carrying the run's result — what judges grade |
| `conversation.id` | Groups the traces of one multi-turn exchange into a session |
| `code.namespace`, `code.function.name` | How a run matches the behaviour the scan found in your code |
| `overmind.behaviour.key` | Names the behaviour explicitly instead of matching on code |
The Python SDK sets all of these for you.
### Reaching the right capability
`overmind.capability.id` takes the capability's UUID or the `key` it has in `overmind.toml`. Both survive renames. A span-level value beats the resource-level one, so one process can serve several capabilities.
An id Overmind doesn't recognise never creates a capability. The span still arrives and is browsable under the **Unbound** filter, but it belongs to no capability, no evaluators score it, and it joins no dataset until the id resolves. Push your scan first, then copy the id or key into `init()`.
`overmind.capability.name` is a display label. It never binds anything on its own.
### Sessions
Put the same `conversation.id` on the traces of one exchange — `set_conversation_id("session-42")`, or `run(conversation_id=...)` — and Overmind groups them into a **session** with its own score, token and cost totals, and timespan. The **Sessions** view lists them.
## Scores on arrival
You don't schedule scoring. When a run finishes, Overmind splits the trace into the units of work it contains, matches each one to a behaviour of your capability, and judges it with that capability's active [eval set](/agent-testing/eval#eval-sets). The result is the **Score** column, with every judge's reasoning behind it.
A run that dies before it finishes shows as **interrupted** and is still scored on what it did. [Trace scoring](/agent-testing/trace-scoring) covers how the score is composed.
## What you see in the Console
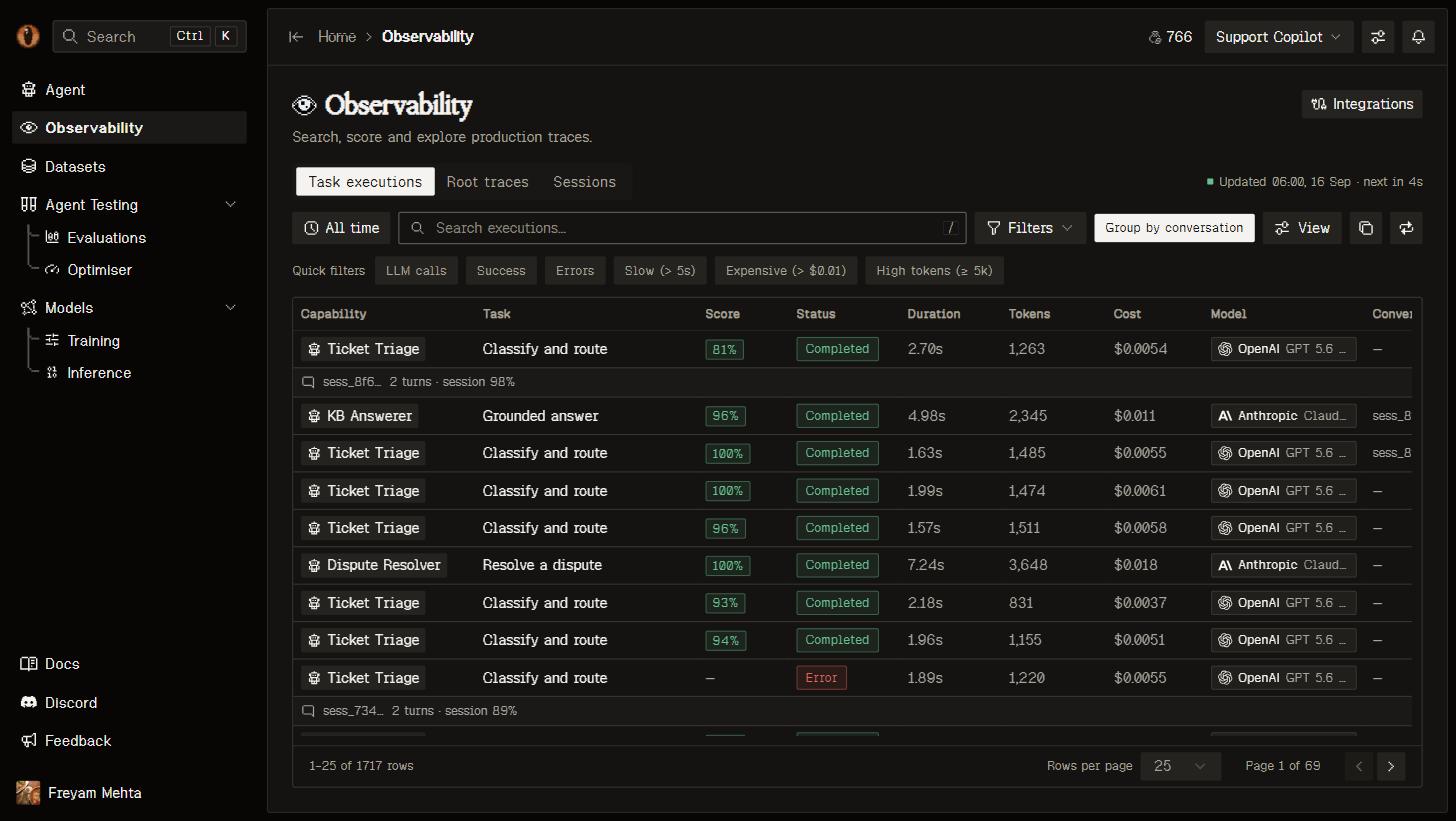
**Observability** is one filterable table with three views:
* **Task executions** (the default) — one row per scored unit of work: the capability, the task it matched, its score, duration, tokens, cost and model. **Group by conversation** folds them under their session.
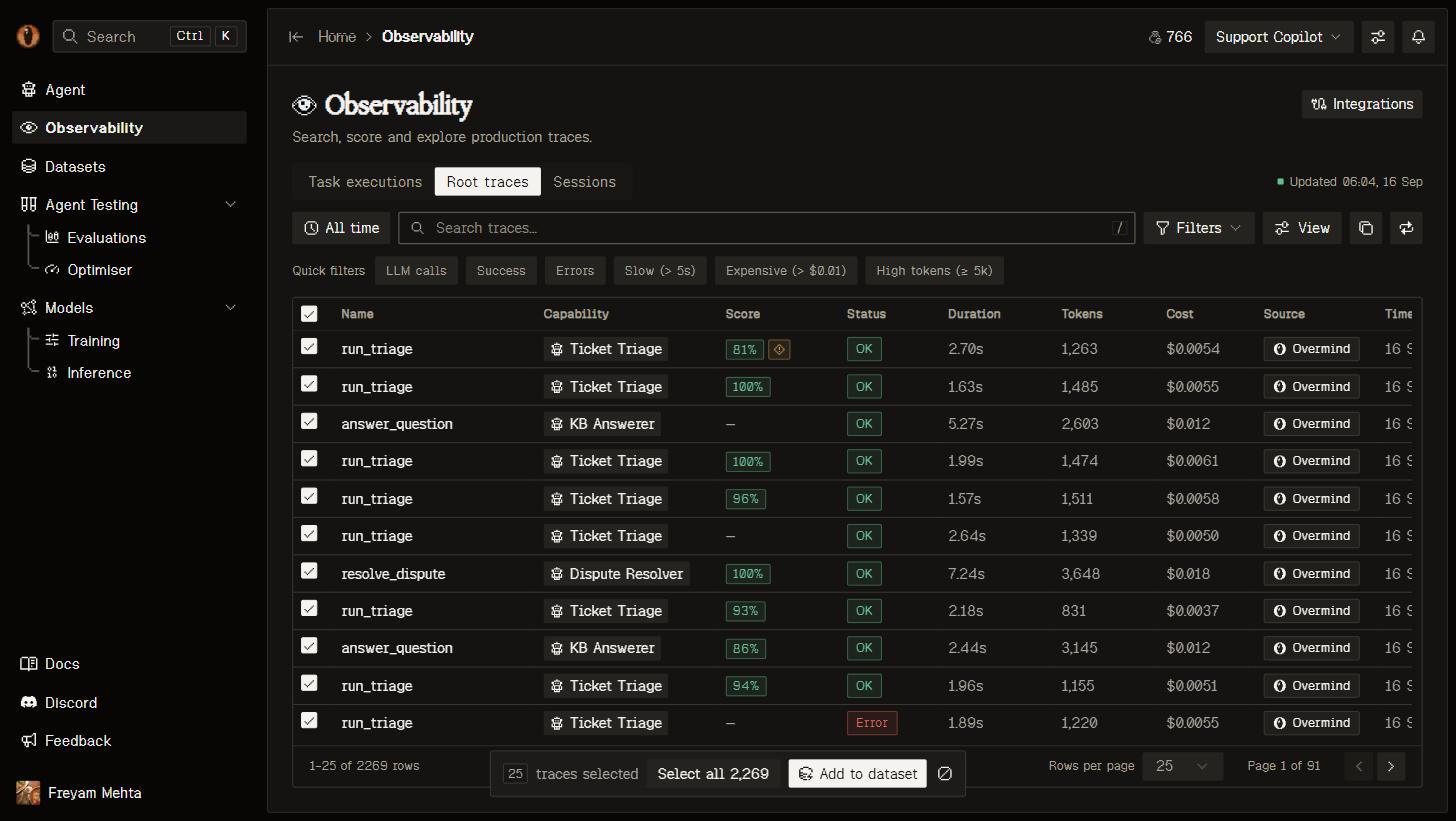
* **Root traces** — one row per run. This is the view you select from to build a dataset.
* **Sessions** — one row per conversation, with its session score.
Quick filters cover the usual questions: **Errors**, **Slow (> 5s)**, **Expensive (> \$0.01)**, **High tokens (≥ 5k)**. Filters, sort, view and page all live in the URL, so any slice you're looking at is a link you can send to someone.
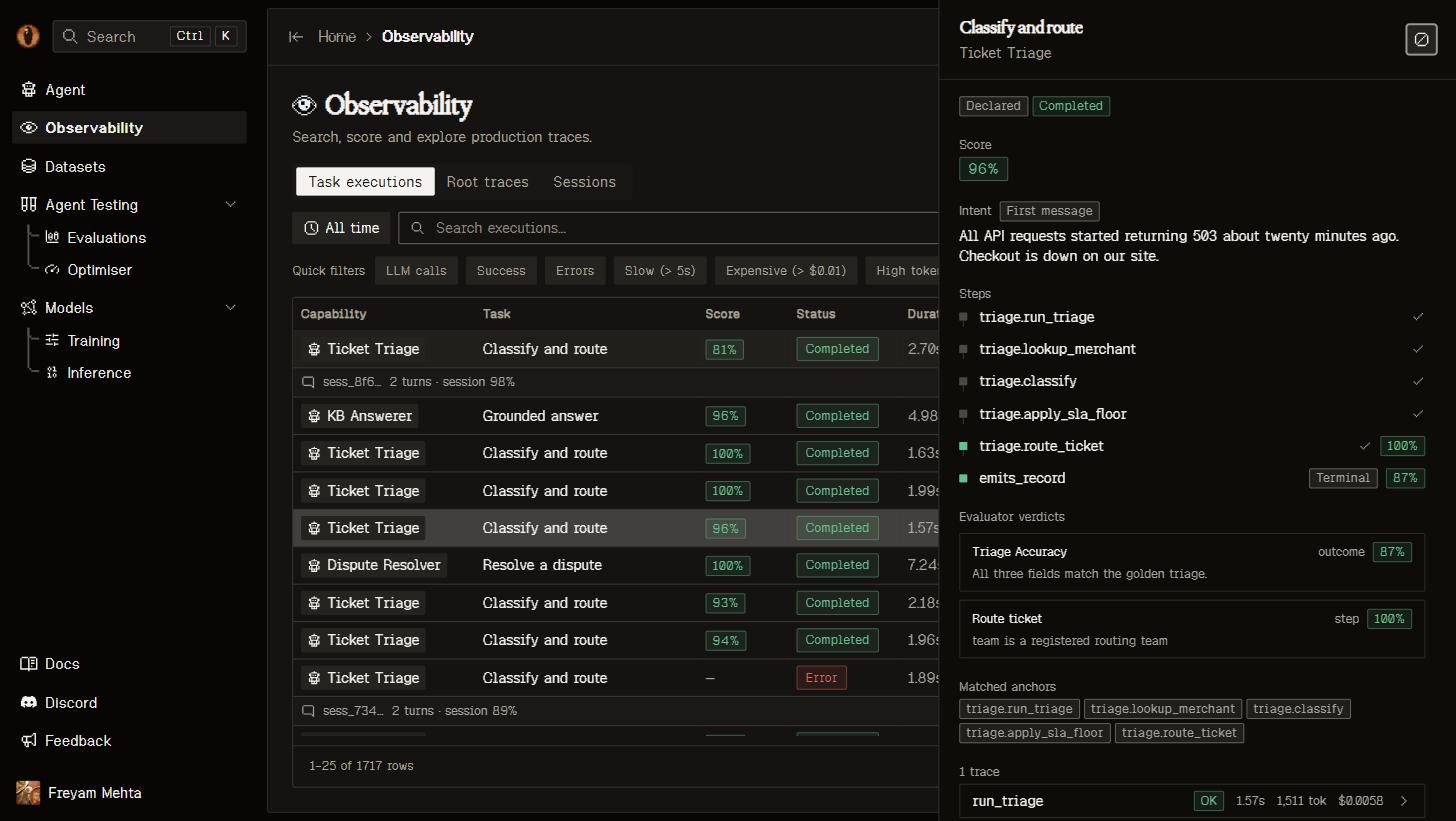
 Click an execution to see what the agent was asked, the route it took through your code, and each judge's verdict with its reasoning — including a marker when two judges disagreed. A conversation opens turn by turn.
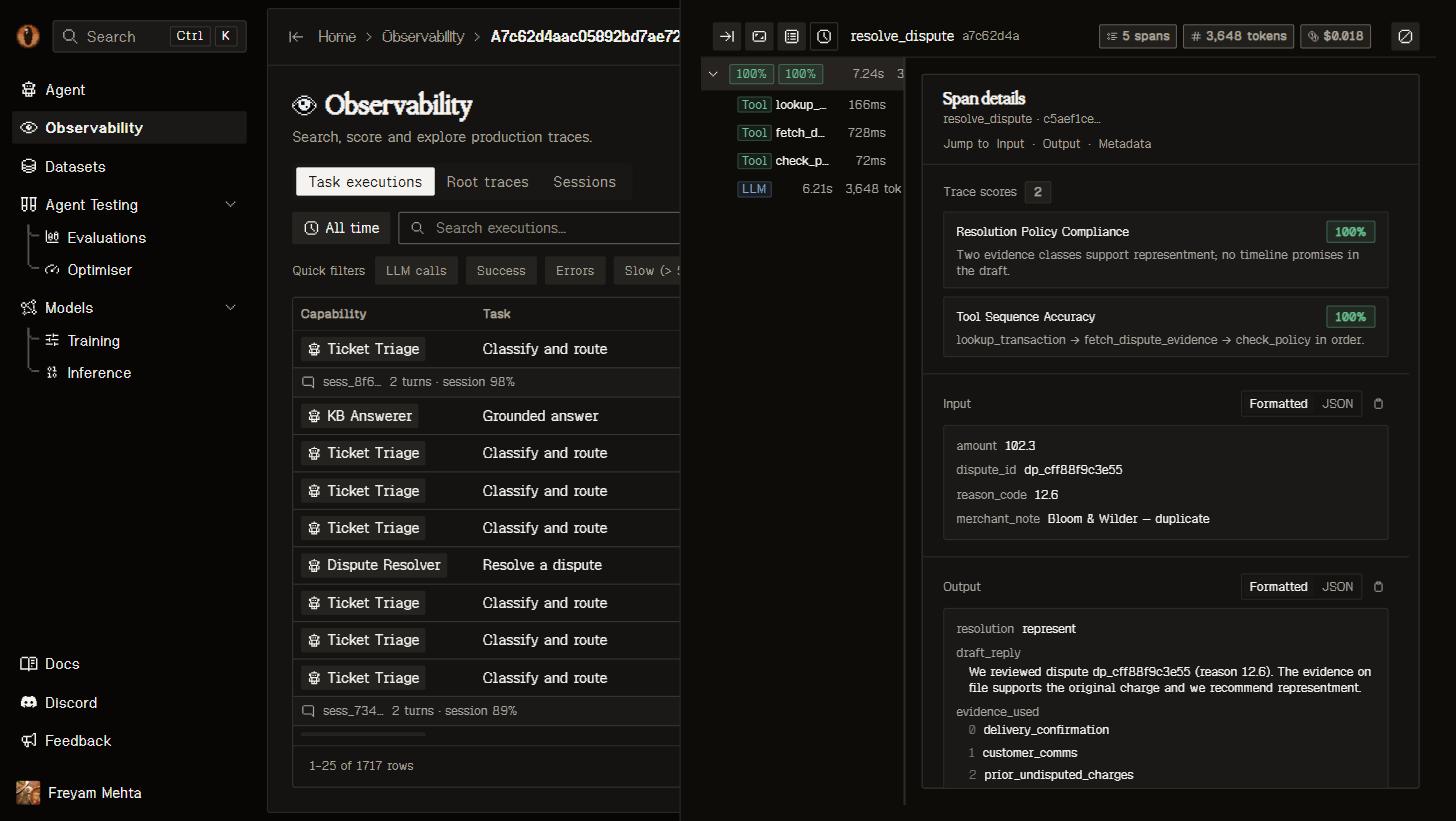
 Click a trace for the span tree — switchable to a flame chart — beside each span's input, output and scores.
 ### From traces to datasets
In **Root traces**, select the runs you want — or **Select all** across pages — and **Add to dataset**. Each trace lands as one row with its transcript, its delivered output, its score and a link back. [Datasets](/core/datasets) is what happens next.
### From traces to datasets
In **Root traces**, select the runs you want — or **Select all** across pages — and **Add to dataset**. Each trace lands as one row with its transcript, its delivered output, its score and a link back. [Datasets](/core/datasets) is what happens next.
 ## Reading traces from your own code
Everything the Console shows is available over REST with the same API key:
```bash theme={"dark"}
# Runs, filtered the same way the Console filters them
curl -H "X-Api-Key: $OVERMIND_API_KEY" \
"https://api.overmindlab.ai/api/traces/?capability={id}&has_error=true"
# One run with all of its spans
curl -H "X-Api-Key: $OVERMIND_API_KEY" \
"https://api.overmindlab.ai/api/traces/{trace_id}/"
# Scored units of work
curl -H "X-Api-Key: $OVERMIND_API_KEY" \
"https://api.overmindlab.ai/api/task-executions/?capability={id}"
```
Because a Console filter is the same query string, you can copy a URL out of your browser and use it as an API recipe. The [REST API](/platform/api) has the full list, and your coding agent has the same reads as MCP tools.
## Good to know
* Call `init()` once at startup, before the first model call, and give each process its own `service_name`.
* Auto-instrumentation alone gives you flat model calls and no score. Wrap each run in `overmind.run()` and call `deliver()` on the result — that's what creates something to judge.
* Decorate the functions your capability's behaviours are anchored on, so each run matches its behaviour and its step judges apply.
* `run()` flushes on exit. For a short script with no run boundary, call `force_flush_traces()` before it ends.
## Next steps
The decorators that make a trace mirror your agent's real control flow.
How a run becomes a score, and what to do when one looks wrong.
Turn the runs you selected into eval or training data.
What the scan found in your repository and how traces attach to it.
## Reading traces from your own code
Everything the Console shows is available over REST with the same API key:
```bash theme={"dark"}
# Runs, filtered the same way the Console filters them
curl -H "X-Api-Key: $OVERMIND_API_KEY" \
"https://api.overmindlab.ai/api/traces/?capability={id}&has_error=true"
# One run with all of its spans
curl -H "X-Api-Key: $OVERMIND_API_KEY" \
"https://api.overmindlab.ai/api/traces/{trace_id}/"
# Scored units of work
curl -H "X-Api-Key: $OVERMIND_API_KEY" \
"https://api.overmindlab.ai/api/task-executions/?capability={id}"
```
Because a Console filter is the same query string, you can copy a URL out of your browser and use it as an API recipe. The [REST API](/platform/api) has the full list, and your coding agent has the same reads as MCP tools.
## Good to know
* Call `init()` once at startup, before the first model call, and give each process its own `service_name`.
* Auto-instrumentation alone gives you flat model calls and no score. Wrap each run in `overmind.run()` and call `deliver()` on the result — that's what creates something to judge.
* Decorate the functions your capability's behaviours are anchored on, so each run matches its behaviour and its step judges apply.
* `run()` flushes on exit. For a short script with no run boundary, call `force_flush_traces()` before it ends.
## Next steps
The decorators that make a trace mirror your agent's real control flow.
How a run becomes a score, and what to do when one looks wrong.
Turn the runs you selected into eval or training data.
What the scan found in your repository and how traces attach to it.